
Connect a voltage sensor to LabQuest CH 1. Open voltage1display.cmbl in Logger Pro.

Connect voltage sensors to LabQuest CH 1 and CH 2. Open voltage2display.cmbl in Logger Pro.
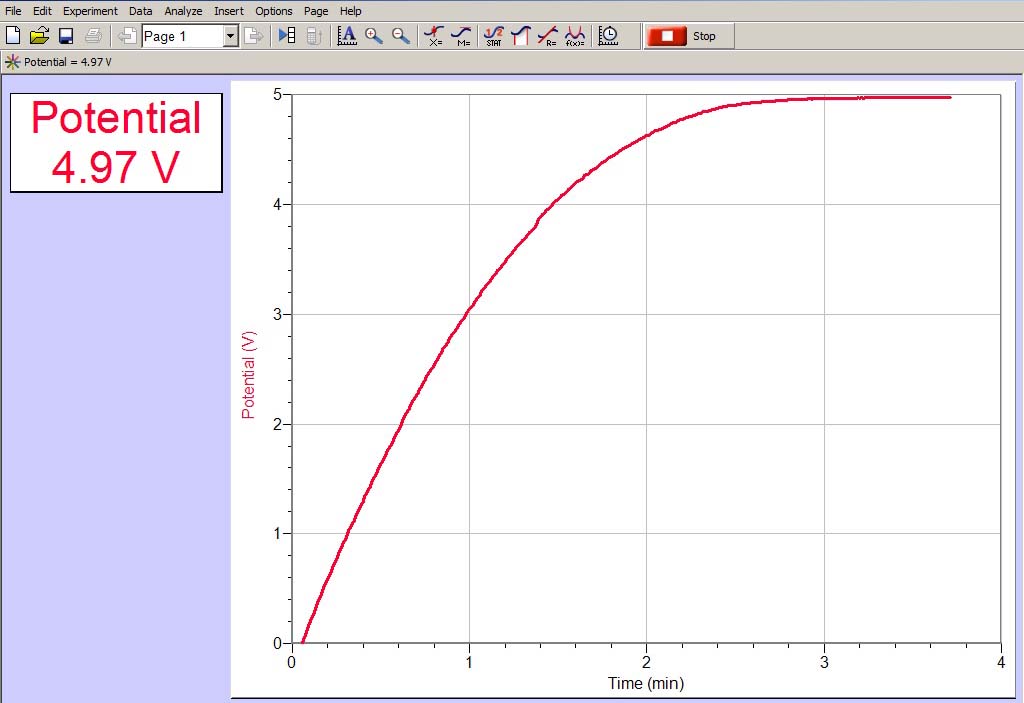
Connect a voltage sensor to LabQuest CH 1. Open voltage1rc.cmbl in Logger Pro. Connect the voltage sensor input across the capacitor in an RC circuit. Click on the green button to start the plot. The plot lasts for 4 minutes. The figure above was generated by first starting the plot and then connecting 5 volts across a resistor and capacitor in series.
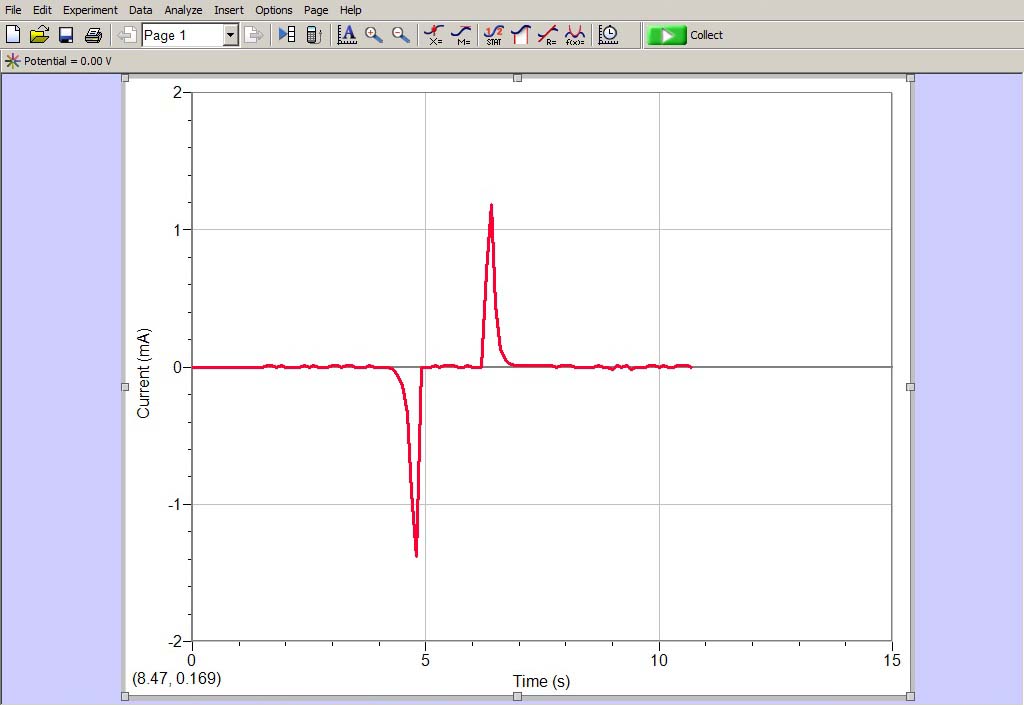
Connect a voltage sensor to LabQuest CH 1. Connect the sensor input across a coil of wire. Connect a 1000-ohm resistor across the sensor input. Open voltage1induced.cmbl in Logger Pro. For this application, you may want to zero the sensor. Click on the green button to start the plot. The plot lasts for 15 seconds. The figure above was generated by inserting a magnet into the coil and then removing the magnet from the coil. Note that the y axis is labeled "current" even though we are actually measuring the voltage across the 1000-ohm resistor. If we measure 1 V across the resistor, then 1 mA is flowing through the resistor and through the coil.
Connect one voltage sensor to LabQuest CH 1, and connect its input across the primary coil of a transformer. Connect the other voltage sensor to LabQuest CH 2, and connect its input across the secondary coil of the transformer. Open voltage2transformer.cmbl in Logger Pro. Click on the Data Collection icon just to the left on the green Collect button on the tool bar. Check the box for Repeat. This causes a new plot to start automatically after each plot is finished. (When you finish this demonstration, uncheck the Repeat box before you close Logger Pro; otherwise it will still be active the next time you open Logger Pro.) Click on the green button to start the plots. Each plot lasts for 0.2 seconds. The figure above was generated by applying an AC signal (10 V amplitude) to the primary coil. The secondary coil was loosely coupled to the primary coil.